Visualization
LogBook
Neural Monkey LogBook is a simple web application for preview the outputs of the experiments in the browser.
The experiment data are stored in a directory structure, where each experiment directory contains the experiment configuration, state of the git repository, the experiment was executed with, detailed log of the computation and other files necessary to execute the model that has been trained.
LogBook is meant as a complement to using TensorBoard, whose summaries are stored in the same directory structure.
How to run it
You can run the server using the following command:
bin/neuralmonkey-logbook --logdir=<experiments> --port=<port> --host=<host>
where <experiments> is the directory where the experiments are listed and <port> is the number of the port the server will run on, and <host> is the IP address of the host (defaults to 127.0.0.1, if you want the logbook to be visible to other computers in the network, set the host to 0.0.0.0)
Then you can navigate in your browser to http://localhost:<port> to view the experiment logs.
TensorBoard
You can use TensorBoard <https://www.tensorflow.org/versions/r0.9/how_tos/summaries_and_tensorboard/index.html> to visualize your TensorFlow graph, see summaries of quantitative metrics about the execution of your graph, and show additional data like images that pass through it.
You can start it by following command:
tensorboard --logdir=<experiments>
And then you can navigate in your browser to http://localhost:6006/ (or if the TensorBoard assigns different port) and view all the summaries about your experiment.
How to read TensorBoard
The step in the TensorBoard is describing how many inputs (not batches) was processed.
Attention Visualization
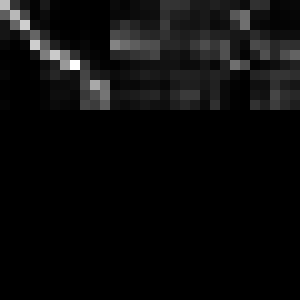
If you are using an attention decoder, visualization of the soft alignment of each sentence in the first validation batch will appear in the Images tab in TensorBoard. The images might look like this:

Here, the source sentence is on the vertical axis and the target sentence on
the horizontal axis. The size of each image is max_output_len * max_input_len so most of the time, there will be some blank rows at the bottom and some trailing columns with “phantom” attention (corresponding to positions after the end of the output sentence).
You can use the tf_save_images.py script to save the whole history of images as a sequence of PNG files:
# For the first sentence in the batch
scripts/tf_save_images.py events.out attention_0/image/0 --prefix images/attention_0_
Use feh to view the images as a time-lapse:
feh -g 300x300 -Z --force-aliasing --slideshow-delay 0.2 images/attention_0_*.png
Or enlarge them and turn them into an animated GIF using:
convert images/attention_0_*.png -scale 300x300 images/attention_0.gif